Create Your First Strategy
Before You Begin
Section titled “Before You Begin”- Make sure TradeHub is running on your device and accessible in your browser.
Main Layout
Section titled “Main Layout”Here’s a quick overview of the main parts of the TradeHub interface.
The top bar contains the Strategy Lab controls, and the left menu is for Navigation.
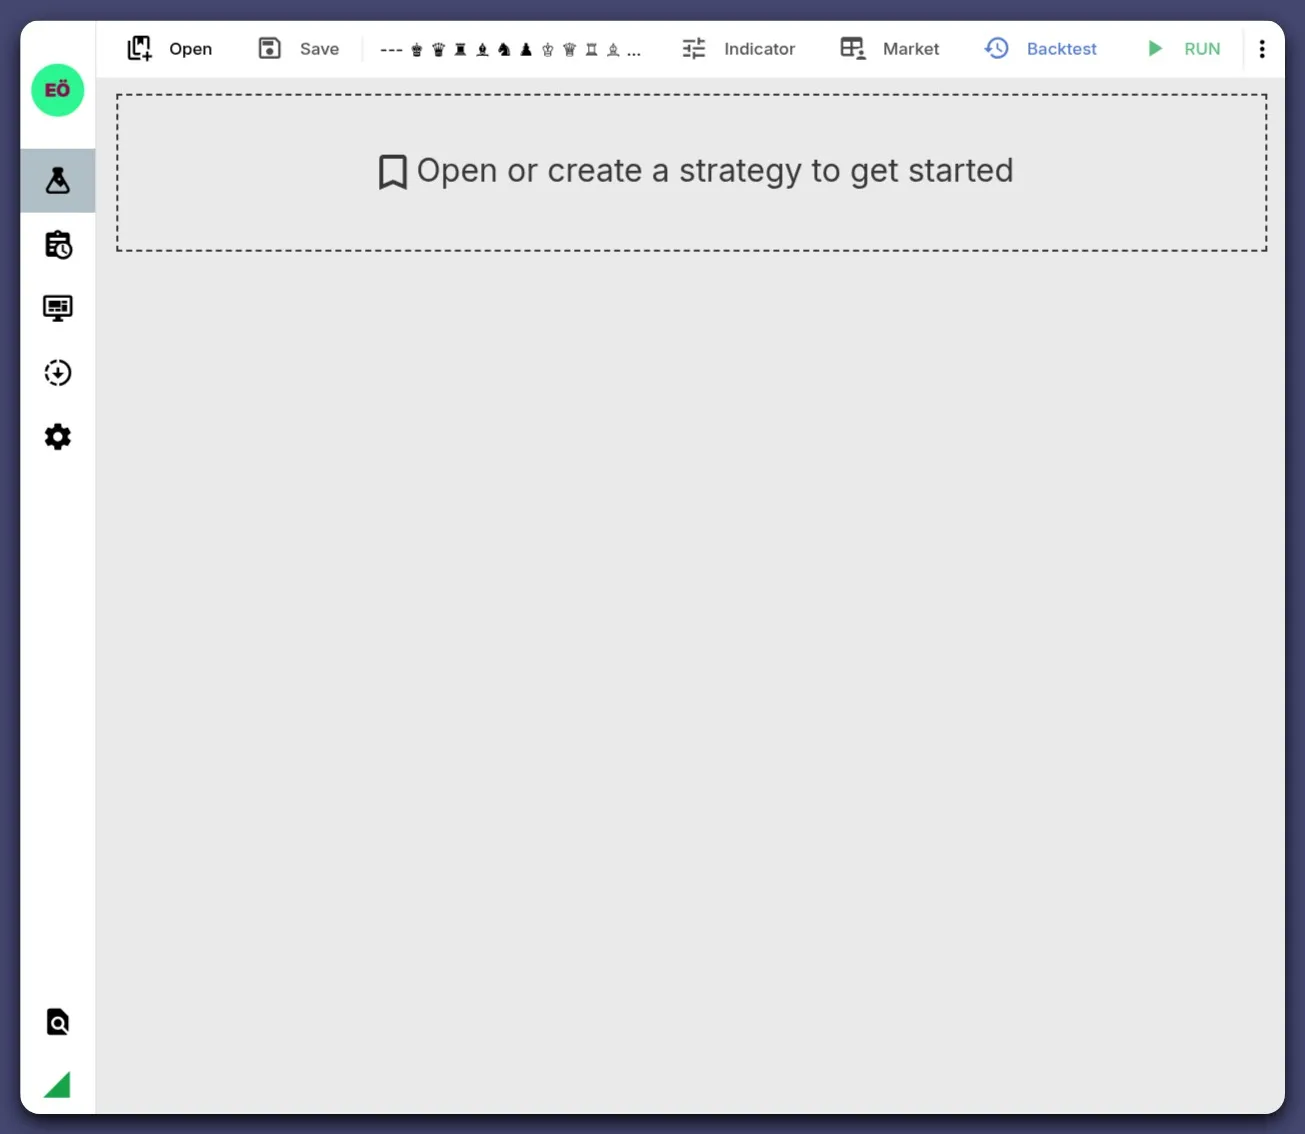
🔴 Strategy Lab Controls (Top Bar)
Section titled “🔴 Strategy Lab Controls (Top Bar)”The following items are explained from left to right, respectively.
- Open – Create or Load an existing strategy.
- Save – Save your current strategy.
- Indicator – Add or edit indicators.
- Market – Select trading pair — Exchange account must be added in settings for Live trade.
- Trader Mode – Choose between trader modes :
Backtest,PaperorLive - Run – Start trader bot with choosen mode.
- Stop – Stop current run.
🟢 Navigation Menu (Left Sidebar)
Section titled “🟢 Navigation Menu (Left Sidebar)”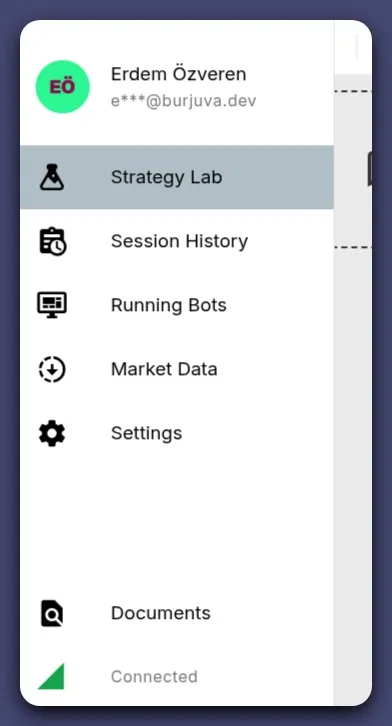 The following items are explained from top to bottom, respectively.
- Strategy Lab – Main workspace for creating strategy and testing.
- Session History – Review past trader sessions or runs.
- Active Traders – View or manage active traders. — Only for
LiveandPapermodes - Market Data – Download and manage market history data for backtest.
- Docs – Open this documentation.
- Status – Web UI connection indicator with TradeHub.
Step-by-Step Guide
Section titled “Step-by-Step Guide”Before creating your first strategy you need a market data for backtesting, click Market Data in main navigation.
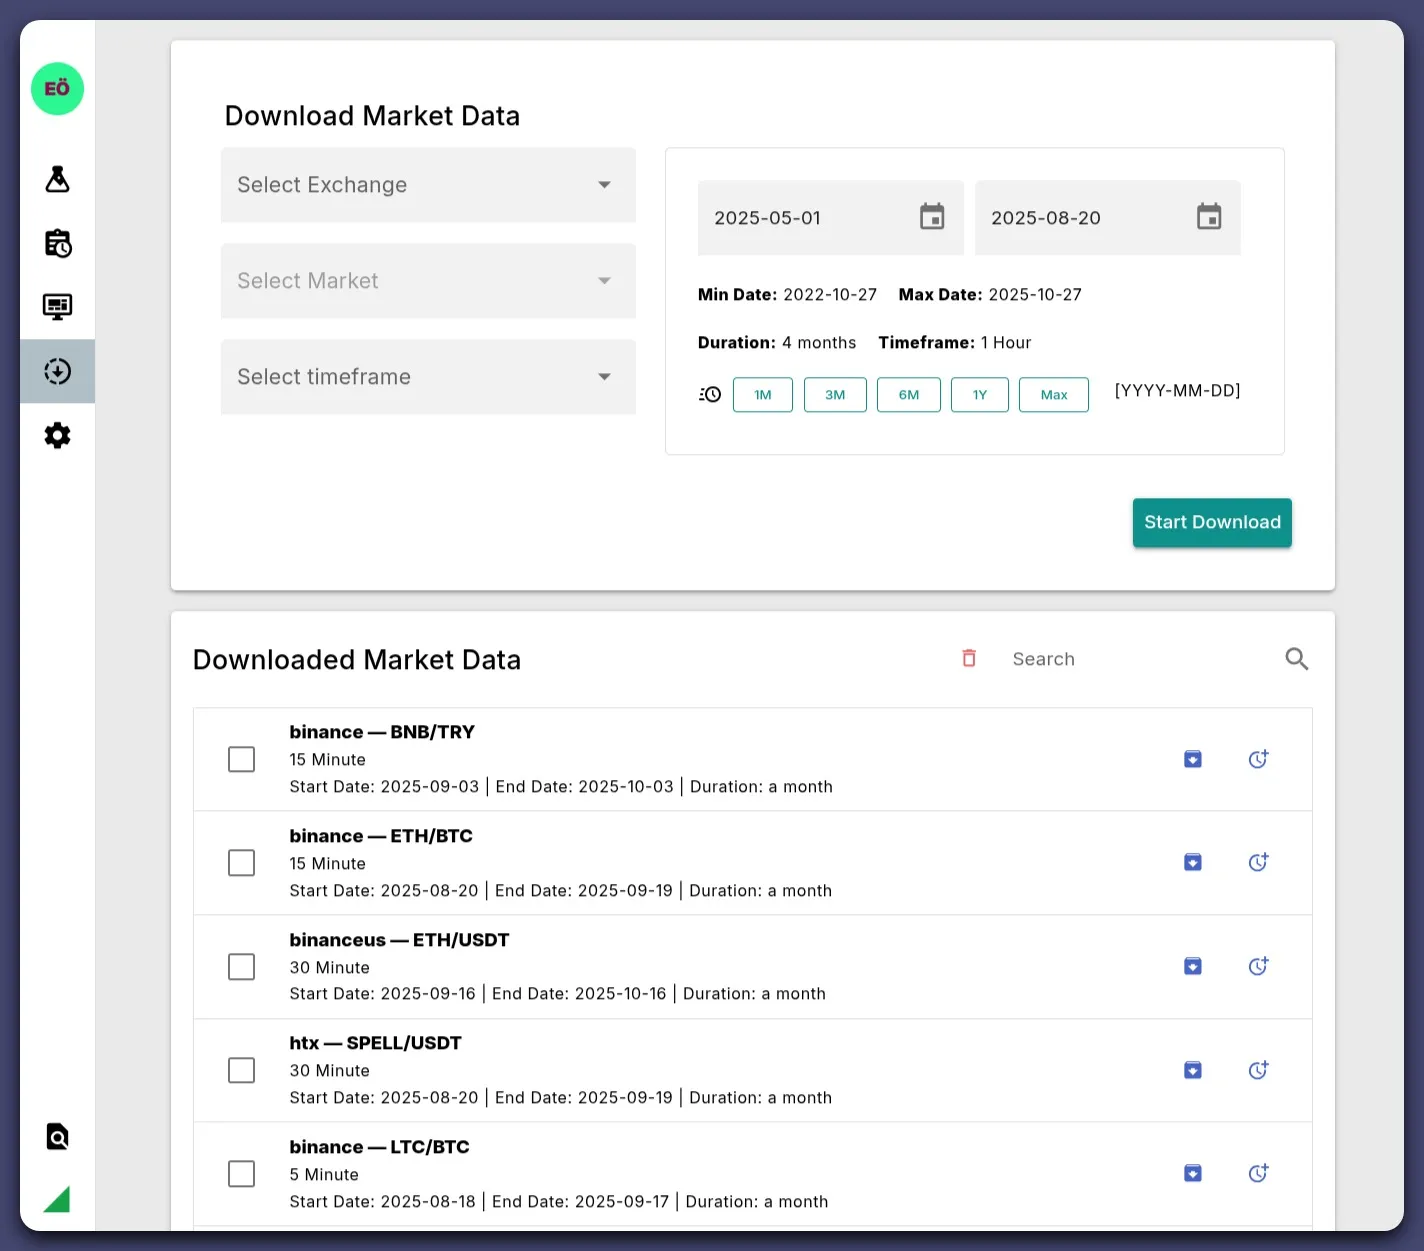
The Market Data page has two sections: Downloader and Downloaded Markets List.
How to Download Market Data
Section titled “How to Download Market Data”-
Select Exchange
-
Select Market
-
Select Timeframe
-
Select Start Date and End Date
- Or use the Quick Selection buttons: 1M, 3M, 6M, 1Y, MAX
- MAX automatically selects the largest possible date range allowed by your plan. Note: Data for the entire MAX range may not be available from the exchange.
-
Click Start Download to begin downloading.
How To Create Strategy
Section titled “How To Create Strategy”-
Click ‘Open’ from the sidebar navigation.
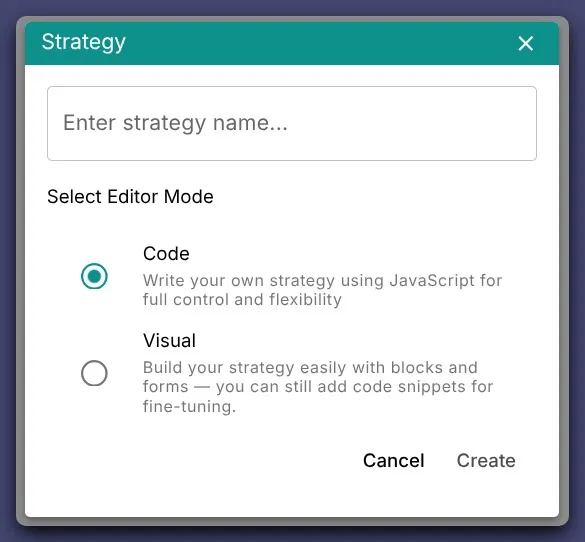
- Press New Strategy at pop-up menu.
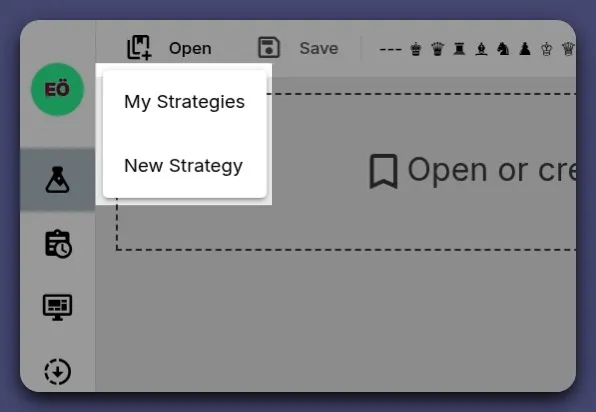
- Press New Strategy at pop-up menu.
-
Name Your Strategy and Choose Your Editor
Choose something descriptive likeEMA Cross Trend Follower.
- Save
Just click Save at the top left — it’s as simple as that!
To open a saved strategy later, click My Strategies in step 1. A list of your strategies will be displayed.
Selecting Market Data for Backtesting
Section titled “Selecting Market Data for Backtesting”In the previous step, you learned how to create and open a strategy. Now, let’s see how to select market data for your strategy to backtest.
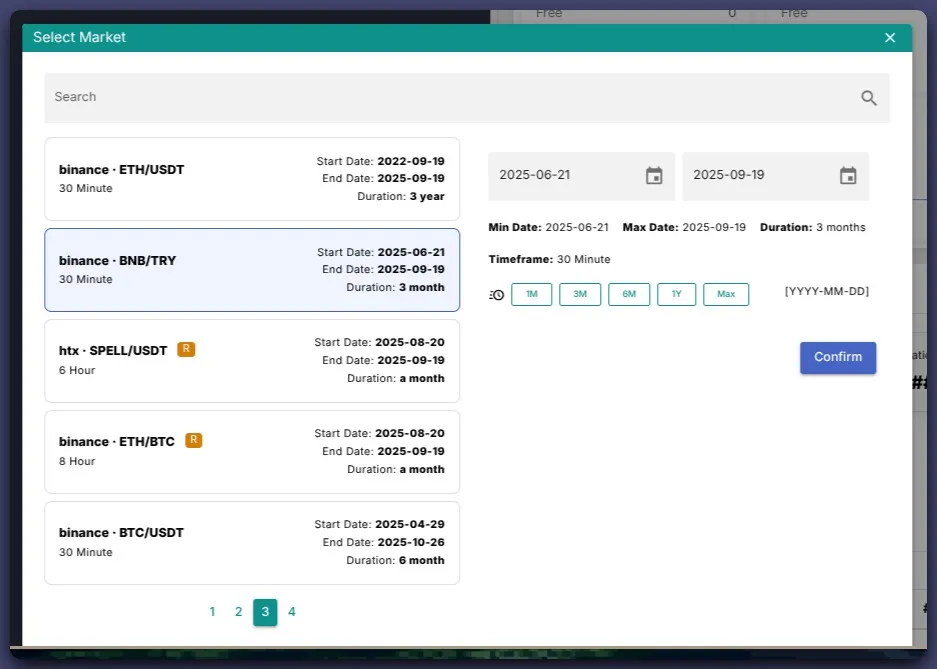
- Click the Market button on the top bar to open the market selection menu.
- A list of your downloaded markets will appear.
- Choose the market you want to backtest.
- Select the date range for testing — it uses the same date range selector as the Market Data Downloader, and Quick Selection options (1M, 3M, 6M, 1Y, MAX) are also available.
Adding and Managing Indicators
Section titled “Adding and Managing Indicators”In your strategy, follow these steps to add or manage indicators:
- Click Indicator in the top bar.
- The indicator menu opens and shows the indicators currently used by the strategy. (If this is your first indicator, the list will be empty.)
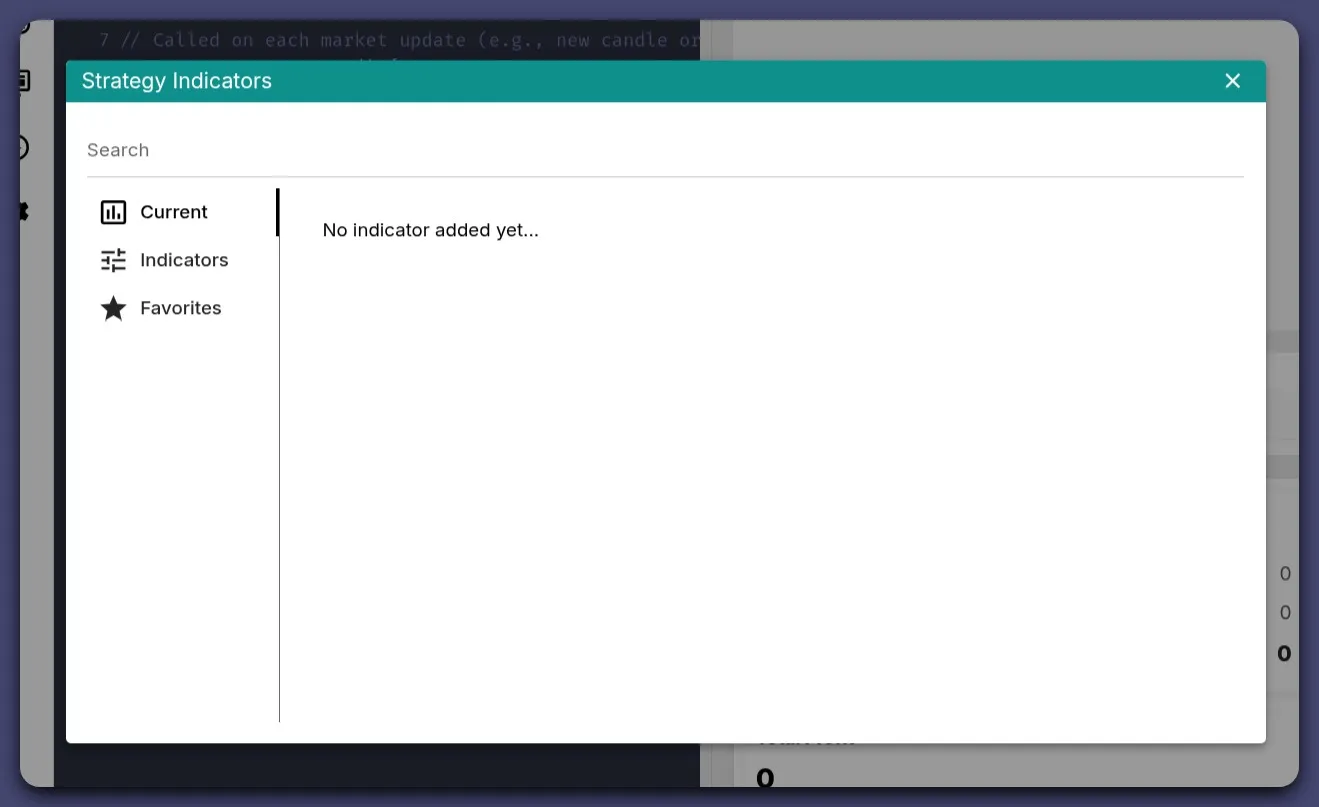
- From the left menu, click Indicators to view the built-in indicators.
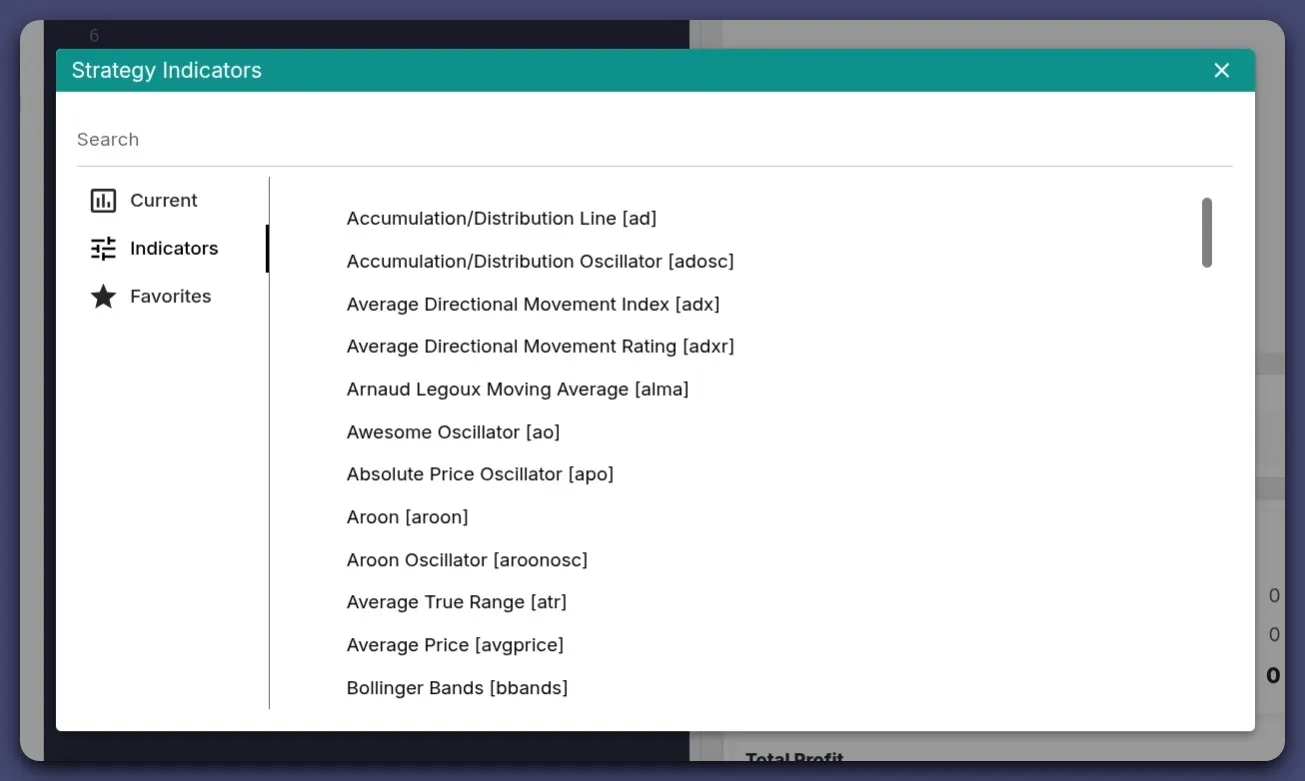
- Select the indicator you want to add. The Indicator Form modal will open.
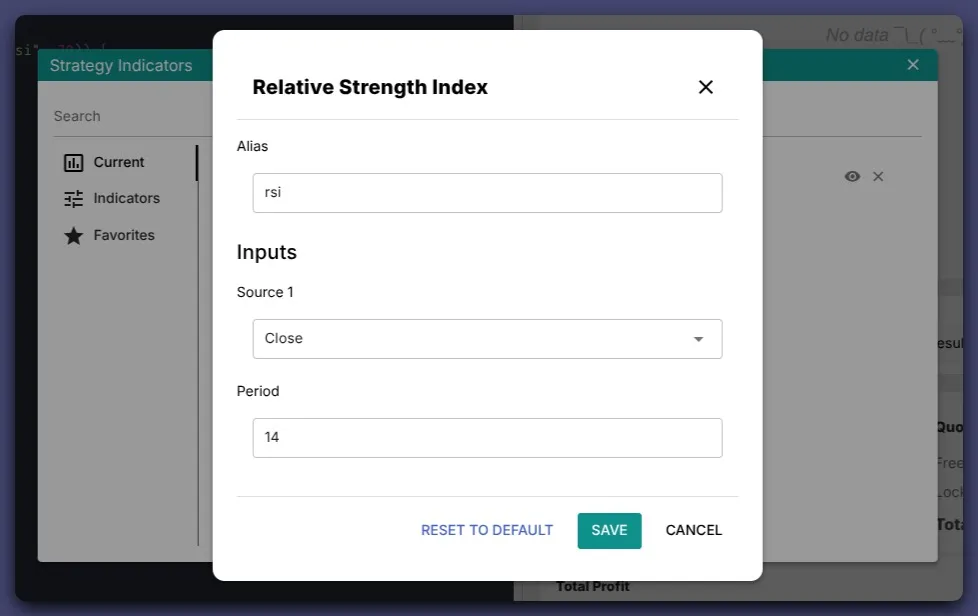
- Alias is the name you use in your strategy code to access an indicator’s value. By default, it is set to the indicator’s short name. For example, if you add multiple EMA indicators, you can rename them to ema_fast and ema_slow to differentiate between them.
- The form displays inputs and parameters for the selected indicator.
- Default values are shown for convenience; they are common settings, not necessarily the best for your strategy.
- Adjust the inputs or parameters as needed.
- Click Add to add the indicator to your strategy.
- Close indicators modal by pressing Esc or clicking the Close button in the top-right corner.
- To edit or remove an indicator later, simply open the Indicator menu again and use the edit or remove options.
Testing Your First Bot with RSI Strategy
Section titled “Testing Your First Bot with RSI Strategy”Let’s write a simple RSI strategy to test our first bot.
// Called once when the strategy is created or loaded// Can be async if you need to fetch or prepare datafunction setup() {  // Initialize variables, indicators or require a plugin here}
// Called on each market update (e.g., new candle or tick)async function update() {  // Main trading logic goes here  // Example logic:  // - Buy when RSI crosses above 30 (oversold)  // - Sell when RSI crosses below 70 (overbought)  if (ta.crossUp("rsi", 30)) {    await order.buy();  } else if (ta.crossDown("rsi", 70)) {    await order.sell();  }}
After adding the code:
- Set Trader Mode to Backtest from the top bar.
- Click Run at the top right to start the backtest.
You’ll now see how your strategy performs based on historical market data.
Troubleshooting
Section titled “Troubleshooting”- Can’t see new strategy? Refresh the page or check if it was saved correctly.
- No trades during simulation? Verify your indicators and conditions.
- Strategy not saving? Ensure you didn’t remove required fields (name, market, etc.).
Next Steps
Section titled “Next Steps”Continue to: Running Your First Simulation